

Abstract
Background There has been a proliferation of urban high-level trauma centers. The aim of this study was to describe the density of high-level adult trauma centers in the 15 largest cities in the USA and determine whether density was correlated with urban social determinants of health and violence rates.
Methods The largest 15 US cities by population were identified. The American College of Surgeons’ (ACS) and states’ department of health websites were cross-referenced for designated high-level (levels 1 and 2) trauma centers in each city. Trauma centers and associated 20 min drive radius were mapped. High-level trauma centers per square mile and per population were calculated. The distance between high-level trauma centers was calculated. Publicly reported social determinants of health and violence data were tested for correlation with trauma center density.
Results Among the 15 largest cities, 14 cities had multiple high-level adult trauma centers. There was a median of one high-level trauma center per every 150 square kilometers with a range of one center per every 39 square kilometers in Philadelphia to one center per596 square kilometers in San Antonio. There was a median of one high-level trauma center per 285 034 people with a range of one center per 175 058 people in Columbus to one center per 870 044 people in San Francisco. The median minimum distance between high-level trauma centers in the 14 cities with multiple centers was 8 kilometers and ranged from 1 kilometer in Houston to 43 kilometers in San Antonio. Social determinants of health, specifically poverty rate and unemployment rate, were highly correlated with violence rates. However, there was no correlation between trauma center density and social determinants of health or violence rates.
Discussion High-level trauma centers density is not correlated with social determinants of health or violence rates.
Level of evidence VI.
Study type Economic/decision.
Background
In 2019, 82.5% of the US population lived in urban areas and that trend is expected to continue to increase to 87.4% by 2050.1 Although people migrate to cities for the economic advantages, cities have dramatically higher rates of poverty, mental illness,2 homelessness, drug use and violence than rural areas.3 As a result of these conditions, intentional injury rates per capita and need for trauma centers may also be higher.
There is growing recognition that the number of trauma centers serving a region influences centers’ volume, training and outcomes. The American College of Surgeons (ACS) Needs Based Assessment of Trauma Systems (NBATS) Tool was designed to determine what that right number of trauma centers should be.4–6 Variables considered include population, geographic size of trauma service areas as well as trauma volumes as captured in administrative and trauma registry data. Yet NBATS treats urban and rural area equally. Population intentional injury rates are very different in urban and rural areas. Although urban areas have denser distribution of trauma centers than rural areas, there may be a population need.7 There remains a critical knowledge gap in the trauma needs of urban environments.
This study sought to describe density of high-level (levels 1 and 2) urban trauma centers and test whether local social and economic conditions in urban environments were associated with density of high-level trauma centers. The first aim of this study was to describe the density of urban adult trauma centers in the 15 largest cities in the USA. The second aim was to test the correlation between social determinants of health, violence and urban trauma center density. The study hypothesis was that cities with worse social determinants of health and higher violence rates would develop more trauma centers to meet that need.
Methods
Study design
This was a cross-sectional study. The source base and setting was the urban population in the US 15 largest cities. The level of analysis was the city, specifically, the strict geographic boundaries of cities. The primary outcome was urban trauma center density. The predictors of interest are social determinants of health and violence rates.
Variable data definition
Cities were defined based on strict geographic borders. The size of the city was based on the population as reported from the 2015 census.8 Cities within geographic borders or metropolitan areas are defined by the Federal Office of Management and Budget as a core area containing a large population nucleus, together with adjacent communities that have a high degree of economic and social integration.9
Data sources and collection
Adult trauma centers were identified through standardized web search of the ACS Committee on Trauma search engine for verified trauma centers.10 These findings were cross-referenced with the American Trauma Society search engine.11 The state-specific department of health or trauma system websites were searched for Illinois, Florida and Pennsylvania, where ACS Verification was uncommon.12–14 Pediatric trauma centers were excluded.
Mapping
The addresses of level 1 and level 2 trauma centers in each city were obtained from the ACS and state trauma websites. These addresses were plotted on the MAPTIVE platform.15 The MAPTIVE platform is a mapping tool licensed with Google Maps for business that provides on-demand, customized mapping solutions. A 20 min drive radius was overlaid around each high-level trauma center to illustrate potential overlapping catchment areas. Drive radius of 20 min was selected, because it was the mode in the NBATS survey and because peak time to death following truncal injury is 30 min.4 16
Demographic and social determinants of health were collected from the US Census Bureau.17 Demographic data included population, size in square miles median age and gender composition. Social determinants of health included were median income, percentage of educational attainment of high school diploma and beyond, poverty rate and unemployment rate. These social determinants of health were considered because they were publicly available for all states that have been associated with unintentional injury and intentional injury. Social determinants of health are associated with violence.18 Violent crime data were collected from Federal Bureau of Investigation Uniform Crime Reports Offenses Known to Law Enforcement Search Engine.19 Violent crime data included rates per 100 000 of homicide, rape, robbery, aggravated assault and total violent crime. This study was exempt from further review by the Northwestern University Institutional Review Board.
Statistical methods
High-level trauma center population density was calculated by dividing the population by the number of level 1 and 2 trauma centers. High-level trauma center geographic density was calculated by dividing the geographic size of the city in square miles by the number of level 1 and 2 trauma centers. Correlation between high-level trauma center density and social determinants of health, as well as violence were tested by calculating a Pearson’s R correlation coefficient. Pearson’s correlation was used to quantify the relationship between two continuous variables, social determinants of health and urban trauma center density.20 21 Pearson’s correlation coefficients were calculated between social determinants of health, violence rates and trauma center density. All analyses were performed using SAS V.9.4.
Results
Descriptive data
Among the 15 largest cities, 14 cities had multiple high-level trauma centers. There was a median of one high-level trauma center per every 58 mi2 with a range of one center per every 15 mi2 in Philadelphia to one center per 230 mi2 in San Antonio (table 1). There was a median of one high-level trauma center per 285 034 people with a range of one center per 175 058 people in Columbus to one center per 870 044 people in San Francisco. The median minimum distance between high-level trauma centers in the 14 cities with multiple centers was 8 kilometers and ranged from 1 kilometer in Houston to 43 kilmoters in San Antonio (figure 1 and online supplemental materials 1–15).
Supplementary data
Supplementary data
Supplementary data
Supplementary data
Supplementary data
Supplementary data
Supplementary data
Supplementary data
Supplementary data
Supplementary data
Supplementary data
Supplementary data
Supplementary data
Supplementary data
Supplementary data
Demographics of largest 15 US metropolitan areas
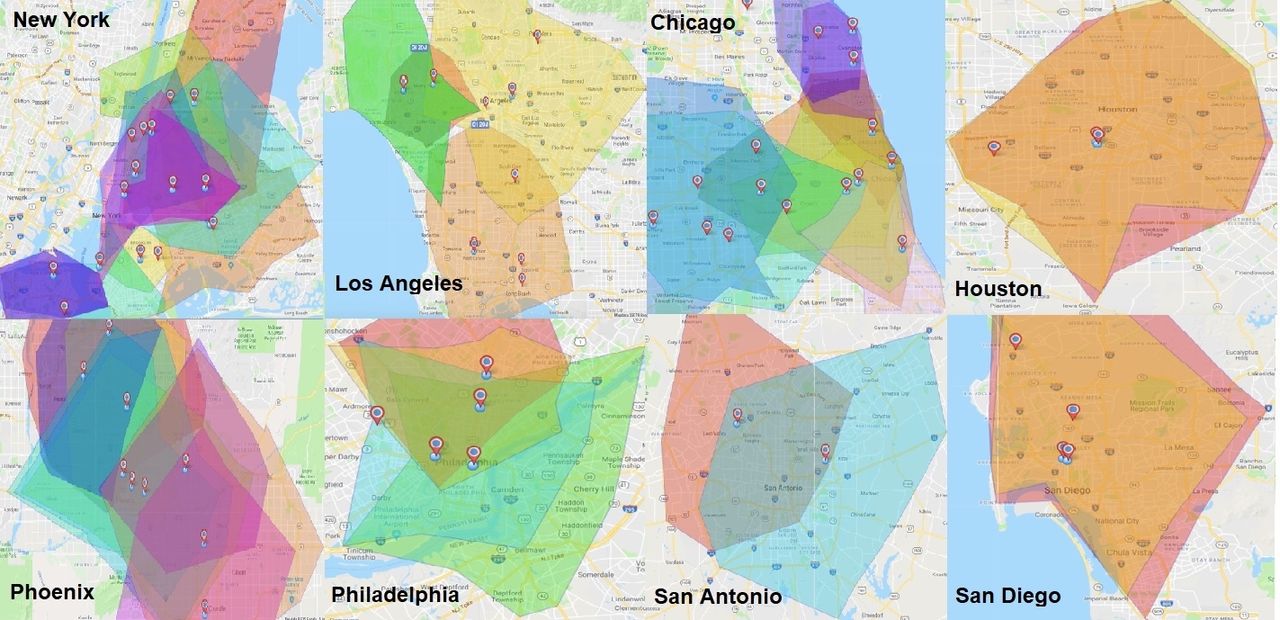
Urban trauma center density. Plots the level 1 and 2 trauma centers in 8 of the largest 15 cities in the USA. Colored polygons represent 20 min drive radius of the level 1 trauma centers. Online supplemental materials include all cities mapped.
Outcome data
Social determinants of health also varied considerably across cities. The median income in 2018 for the 15 largest US cities was $54 765 with a range of $43 744 in Philadelphia to $104 234 in San Jose (table 2). The poverty rate was a median of 19% with a range of 9.1% in San Jose to 24.9% in Philadelphia. There was a median unemployment rate of 4% ranging from 2.6% in San Francisco to 5% in Philadelphia.
Demographics and social determinants of health by metropolitan area
The median total violent crime rate was 123 per 100 000 with a range of 44 per 100 000 in Austin to 562 per 100 000 in New York City (table 3). The median homicide rate was 2 per 100 000 people with a range of 0.3 per 100 000 in San Jose to 6.7 per 100 000 in Chicago.
Violent crimes by metropolitan areas (per 100 000)
Main results
Social determinants of health, particularly rates of poverty and unemployment, showed strong significant correlations with homicide rates, r=0.6, p=0.01, and r=0.8, p=0.0001, respectively. There was no correlation between trauma center population density or geographic density and social determinants of health captured. There was no correlation between state designated level one trauma center population or geographic density and violence rates (table 4). The analysis was replicated with state designated high-level trauma center population and geographic density, and the results were robust.
Correlation between social determinants of health, violence and trauma center density
Discussion
The regional evolution of trauma centers developed to meet the local needs.22 This study sought to describe the density of high-level trauma centers in the 15 largest cities in the USA and explore potential local social and economic conditions that could explain why the density of high-level trauma centers developed in each city.
This study’s key result was that social determinants of health, specifically poverty rate and unemployment rate, were highly correlated with violence rates. These findings were interpreted to fit in with current evidence because previous literature has well documented how social determinants of health influence the population health.23–25 Health systems are increasingly addressing the social determinants of health to reduce disease burden and healthcare utilization.26–28 Health policy changes can also influence social determinants of health and ultimately health.29
A second key result of this study was that social determinants of health and violence rates were not associated with urban trauma center density. The distribution of violence is concentrated in certain neighborhoods and prior studies have shown the density of poverty and violence may be inversely associated with density of trauma centers.30–32 Furthermore, trauma center closures over the last 20 years have disproportionately occurred in low-income areas.33 This body of literature suggests the high density of urban trauma centers observed in this study may be due to financial motivations rather than a community need. Trauma care has become increasingly profitable with the expansion of health insurance coverage.34 At the same time overall reimbursement has fallen, and hospitals left in a lurch may see trauma care as an opportunity.35 Furthermore, certain states provide financial incentives to hospitals to become trauma centers.36 These financial motivations may encourage hospitals to develop trauma centers to remain competitive in the landscape of US healthcare. As urban trauma centers proliferate, volumes may fall for all urban centers and the long-term implications on training, quality of care outcomes and financial solvency of safety net urban trauma centers may be seriously impacted.
There are several limitations to this study. First, it was limited to the 15 largest cities in the USA, and therefore, is not necessarily representative of the entire US population and may have influence generalizability. However, by focusing on the largest cities, it captured a large proportion of urbanites in the USA. Second, these calculations were based on the geographic boundaries of each city and do not include the full trauma service area. Catchment population is a large confounding factor in trying to correlate urban trauma center density with population-based healthcare needs. Third, since the analysis was limited to 15 cities, the study may have been under powered to detect weak correlations and prevented the study from being sufficiently powered for a multivariable analysis. Fourth, this study focused on violence as a cause of injury, when unintentional injury accounts for a larger proportion of all injuries. However, violence is consistently more common in urban environments, which was the study’s focus. Fifth, there may be other trauma centers that are state designated but not ACS verified or low-level trauma centers that care for injured patients due to geographic location that were not captured in this analysis. Future directions include engaging urban trauma centers to better understand the important stakeholders in caring for injured urban patients within each city. Sixth, the exclusion of low-level trauma centers may underestimate the density of trauma expertise in each city as well as dilute trauma centers’ patient volume. Seventh, criteria for levels I and II center state designation vary greatly from state to state and vary from ACS verification criteria. Some state designated leve II trauma centers may not be able to provide 24 hours/7 day a weeks access to the full gamet of trauma subspecialty care. Considering these state designated trauma centers in our analysis may be overestimating the density of capacity and capabilities in caring for severely injured patients in each city. Eighth, many social determinants of health do not have a recognized metric systems that would enable statistical testing. There may be a relationship between these unmeasurable social determinants of health and urban density, and evaluating this would require an exploratory qualitative analysis that could capture such variables. Finally, all the data used in this study was publicly available and obtained via federal and state governments. There were some incomplete and missing data that limited the analyses.
In conclusion, there is high degree of urban trauma center density that is not correlated with social determinants of health or violence rates. It is unclear why the high degree of urban trauma center density has evolved. However, the high density could have important implications on volume, training, outcomes and financial solvency of safety net trauma centers. Institution-level data should be evaluated to determine the effect of density on volume, training and outcomes. Future directions include qualitatively assessing why there is a high density of trauma centers in urban areas.
Footnotes
Presented at This work was presented at the 50th Annual Meeting of Western Trauma Association, 24–29 February 2020, Sun Valley, Idaho.
Contributors Study design was performed by AMS and MLC. Data collection and analysis was performed by AMS and AB. Data interpretation, writing and critical revision were performed by all authors.
Funding The authors have not declared a specific grant for this research from any funding agency in the public, commercial or not-for-profit sectors.
Map disclaimer The depiction of boundaries on this map does not imply the expression of any opinion whatsoever on the part of BMJ (or any member of its group) concerning the legal status of any country, territory, jurisdiction or area or of its authorities. This map is provided without any warranty of any kind, either express or implied.
Competing interests None declared.
Patient consent for publication Not required.
Provenance and peer review Not commissioned; externally peer reviewed.
Data availability statement Data are available in a public, open access repository. All data are publicly available.
This is an open access article distributed in accordance with the Creative Commons Attribution Non Commercial (CC BY-NC 4.0) license, which permits others to distribute, remix, adapt, build upon this work non-commercially, and license their derivative works on different terms, provided the original work is properly cited, appropriate credit is given, any changes made indicated, and the use is non-commercial. See: http://creativecommons.org/licenses/by-nc/4.0/.


