
Main menu

  • Latest content
    • Latest content
  • Archive
  • About the journal
    • About the journal
    • Editorial board
    • Information for authors
    • FAQs
    • Thank you to our reviewers
    • The American Association for the Surgery of Trauma
  • Submit a paper
    • Online submission site
    • Information for authors
  • Email alerts
    • Email alerts
  • Help
    • Contact us
    • Feedback form
    • Reprints
    • Permissions
    • Advertising
  • BMJ Journals

User menu

  • Login

Search

  • Advanced search
  • BMJ Journals
  • Login
  • Facebook
  • Twitter
TSACO

Advanced Search

  • Latest content
    • Latest content
  • Archive
  • About the journal
    • About the journal
    • Editorial board
    • Information for authors
    • FAQs
    • Thank you to our reviewers
    • The American Association for the Surgery of Trauma
  • Submit a paper
    • Online submission site
    • Information for authors
  • Email alerts
    • Email alerts
  • Help
    • Contact us
    • Feedback form
    • Reprints
    • Permissions
    • Advertising
Open Access

Brain proteomic changes by histone deacetylase inhibition after traumatic brain injury

Luke Pumiglia, Aaron M Williams, Michael T Kemp, Glenn K Wakam, Hasan B Alam, Ben E Biesterveld
DOI: 10.1136/tsaco-2021-000682 Published 24 March 2021
Luke Pumiglia
1University of Michigan, Ann Arbor, Michigan, USA
  • Find this author on Google Scholar
  • Find this author on PubMed
  • Search for this author on this site
Aaron M Williams
2Department of Surgery, University of Michigan, Ann Arbor, Michigan, USA
  • Find this author on Google Scholar
  • Find this author on PubMed
  • Search for this author on this site
Michael T Kemp
2Department of Surgery, University of Michigan, Ann Arbor, Michigan, USA
  • Find this author on Google Scholar
  • Find this author on PubMed
  • Search for this author on this site
Glenn K Wakam
2Department of Surgery, University of Michigan, Ann Arbor, Michigan, USA
  • Find this author on Google Scholar
  • Find this author on PubMed
  • Search for this author on this site
  • ORCID record for Glenn K Wakam
Hasan B Alam
2Department of Surgery, University of Michigan, Ann Arbor, Michigan, USA
3Department of Surgery, Northwestern University, Evanston, Illinois, USA
  • Find this author on Google Scholar
  • Find this author on PubMed
  • Search for this author on this site
Ben E Biesterveld
2Department of Surgery, University of Michigan, Ann Arbor, Michigan, USA
  • Find this author on Google Scholar
  • Find this author on PubMed
  • Search for this author on this site
  • ORCID record for Ben E Biesterveld
  • Article
  • Figures & Data
  • eLetters
  • Info & Metrics
  • PDF
Loading

Article Figures & Data
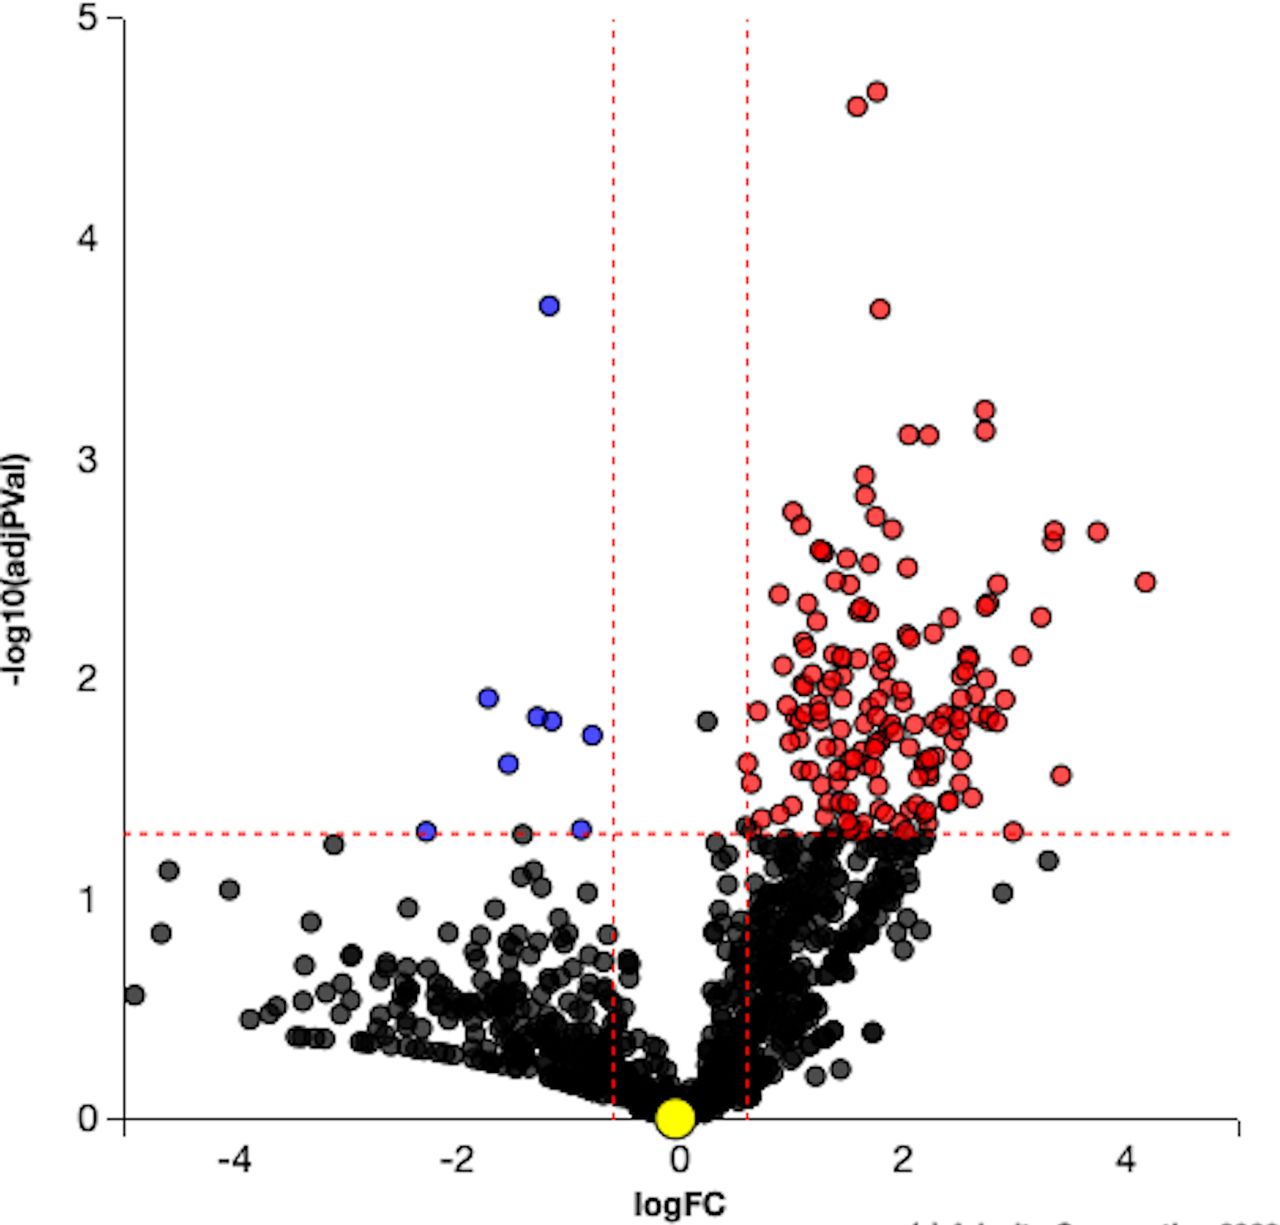
Figures

  • Tables
  • Supplementary Materials
  • Additional Files
  • Figure 1
    • Download figure
    • Open in new tab
    • Download powerpoint
    Figure 1

    Volcano plot. Differentially expressed (DE) proteins are represented in terms of their measured significance of the change (y-axis) and the expression change (x-axis). Dotted lines represent the thresholds used to select the DE genes: 0.6 for expression change and 0.05 for p value. The upregulated proteins (positive log fold change) are shown in red, whereas the downregulated genes are blue. Insignificant proteins are shown in black.
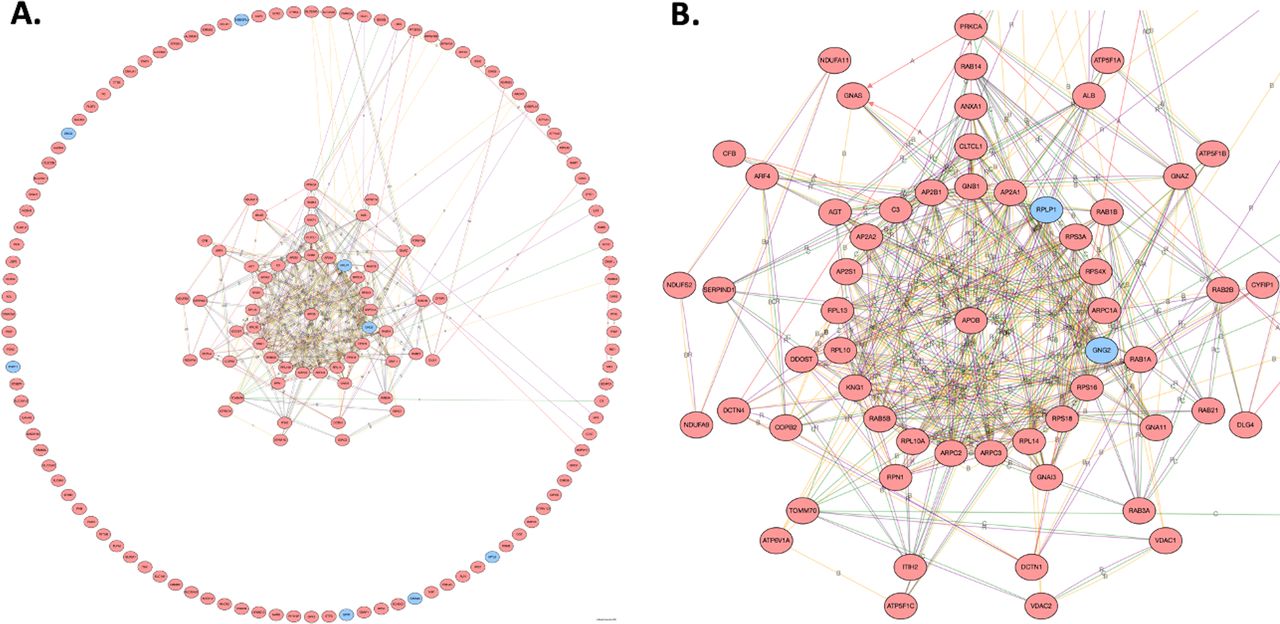
  • Figure 2
    • Download figure
    • Open in new tab
    • Download powerpoint
    Figure 2

    (A) Broad perspective of protein:protein interaction showing clusters of highly connected subnetworks of interconnected proteins. (B) Zoomed perspective of protein:protein interaction showing central suite of largest network. The higher the number of connections, the closer to the center The gene will be drawn. Blue indicates a downregulated differentially expressed (DE) protein, and red indicates an upregulated DE protein. A, activation; B, binding; C, catalysis; R, reaction.

  • Figure 3
    • Download figure
    • Open in new tab
    • Download powerpoint
    Figure 3

    Enrichment map from gene set enrichment analysis) illustrating networks of significantly enriched gene sets from proteomic analysis. Node size represents the number of genes in the gene set; edge thickness is proportional to the overlap between gene sets; red represents upregulation with valproic acid treatment.

  • Figure 4
    • Download figure
    • Open in new tab
    • Download powerpoint
    Figure 4

    Cellular networks affected by VPA treatment. Enriched gene sets based on differentially expressed proteins and subsequent enrichment analysis mapped into common clusters. Nodes represent pathways and edges represent overlapping genes. Increasing node size represents increased number of proteins contributing to that pathway. Increasing edge thickness represents increased overlap between pathways. Node darkness corresponds to decreasing p value according to legend in bottom right. VPA, valproic acid.

Tables

  • Figures
  • Supplementary Materials
  • Additional Files
  • Table 1

    Gene ontology (GO) biologic processes significantly enriched after valproic acid treatment

    GO term# proteins (DE/all)P value
    Low-density lipoprotein particle clearance6/90.002
    ATP hydrolysis coupled cation transmembrane transport9/190.003
    SRP-dependent cotranslational protein targeting to membrane10/240.005
    Viral transcription10/240.005
    Ephrin receptor signaling pathway7/150.009
    Membrane organization31/1120.01
    Regulation of hormone secretion9/30.012
    G protein-coupled receptor signaling pathway, coupled to cyclic nucleotide second messenger9/170.018
    Response to insulin11/330.021
    Generation of precursor metabolites and energy30/1100.026
    Nuclear-transcribed mRNA catabolic process10/300.028
    Mitochondrion organization20/750.03
    Retrograde vesicle-mediated transport, Golgi to Endoplasmic Reticulum (ER)5/110.031
    Regulation of neurotransmitter transport10/190.033
    Regulation of nucleotide metabolic process6/150.036
    Gluconeogenesis7/190.037
    Antigen processing and presentation7/190.037
    Dendrite morphogenesis7/190.037
    Monovalent inorganic cation transport16/580.038
    Cellular response to hormone stimulus19/640.04
    Metal ion transport20/770.04
    ATP metabolic process19/730.044
    Regulation of dendrite development5/120.046
    Regulation of peptidyl-tyrosine phosphorylation6/160.049
    Tricarboxylic acid cycle7/200.049
    • # proteins are the number of proteins differentially expressed in this proteomic data set out of the total number of proteins that contribute to that GO term.

    • P value represents the corrected p value after Elim pruning.

  • Table 2

    Gene ontology (GO) molecular functions significantly enriched after valproic acid treatment

    GO term# proteins (DE/all)P value
    GTP binding18/510.002
    GTPase activity14/380.003
    Structural constituent of ribosome9/200.004
    Clathrin adaptor activity4/50.004
    Ionotropic glutamate receptor binding3/30.005
    Organic anion transmembrane transporter activity6/120.01
    Active transmembrane transport activity11/270.02
    Drug transmembrane transporter activity4/70.021
    Hexosyl transferase activity4/70.021
    6-phosphofructokinase activity2/20.031
    Malate dehydrogenase activity2/20.031
    Calcium-transporting ATPase activity2/20.031
    Voltage-gated anion channel activity2/20.031
    Oxaloacetate decarboxylase activity2/20.031
    Porin activity2/20.031
    G protein-coupled serotonin receptor binding2/20.031
    Angiostatin binding2/20.031
    Alpha-glucosidase activity2/20.031
    Purine ribonucleotide binding47/1780.033
    Isocitrate dehydrogenase activity3/50.042
    GTP-dependent protein binding3/50.042
    Potassium ion binding3/50.042
    • # proteins are the number of proteins differentially expressed in this proteomic data set out of the total number of proteins that contribute to that GO term. P value represents the corrected p value after Elim pruning.

Supplementary Materials

  • Figures
  • Tables
  • Additional Files
  • Supplementary data

    [tsaco-2021-000682supp001.xlsx]

Additional Files

  • Figures
  • Tables
  • Supplementary Materials
  • Supplementary Data

    This web only file has been produced by the BMJ Publishing Group from an electronic file supplied by the author(s) and has not been edited for content.

    • Data supplement 1
PreviousNext
Back to top
Email

Thank you for your interest in spreading the word on TSACO.

NOTE: We only request your email address so that the person you are recommending the page to knows that you wanted them to see it, and that it is not junk mail. We do not capture any email address.

Enter multiple addresses on separate lines or separate them with commas.
Brain proteomic changes by histone deacetylase inhibition after traumatic brain injury
(Your Name) has sent you a message from TSACO
(Your Name) thought you would like to see the TSACO web site.
CAPTCHA
This question is for testing whether or not you are a human visitor and to prevent automated spam submissions.
Print
Alerts
Sign In to Email Alerts with your Email Address
Citation Tools
Brain proteomic changes by histone deacetylase inhibition after traumatic brain injury
Luke Pumiglia, Aaron M Williams, Michael T Kemp, Glenn K Wakam, Hasan B Alam, Ben E Biesterveld
Trauma Surg Acute Care Open Mar 2021, 6 (1) e000682; DOI: 10.1136/tsaco-2021-000682

Citation Manager Formats

  • BibTeX
  • Bookends
  • EasyBib
  • EndNote (tagged)
  • EndNote 8 (xml)
  • Medlars
  • Mendeley
  • Papers
  • RefWorks Tagged
  • Ref Manager
  • RIS
  • Zotero
Cite This
  • APA
  • Chicago
  • Endnote
  • MLA
Loading
Brain proteomic changes by histone deacetylase inhibition after traumatic brain injury
Luke Pumiglia, Aaron M Williams, Michael T Kemp, Glenn K Wakam, Hasan B Alam, Ben E Biesterveld
Trauma Surg Acute Care Open Mar 2021, 6 (1) e000682; DOI: 10.1136/tsaco-2021-000682
Download PDF

Share
Brain proteomic changes by histone deacetylase inhibition after traumatic brain injury
Luke Pumiglia, Aaron M Williams, Michael T Kemp, Glenn K Wakam, Hasan B Alam, Ben E Biesterveld
Trauma Surgery & Acute Care Open Mar 2021, 6 (1) e000682; DOI: 10.1136/tsaco-2021-000682
del.icio.us logo Digg logo Reddit logo Twitter logo CiteULike logo Facebook logo Google logo Mendeley logo
Respond to this article
  • Tweet Widget
  • Facebook Like
  • Google Plus One
  • Article
    • Abstract
    • Introduction
    • Materials and methods
    • Results
    • Discussion
    • Footnotes
    • References
  • Figures & Data
  • eLetters
  • Info & Metrics
  • PDF

Related Articles

Cited By...

More in this TOC Section

  • Bicyclists injured by automobiles: helmet use and the burden of injury
  • What happens after they survive? The role of anticoagulants and antiplatelets in IVC injuries
  • Building trauma capability: using geospatial analysis to consider military treatment facilities for trauma center development
Show more Original research

Similar Articles


CONTENT

  • Latest content
  • Archive
  • eLetters
  • Sign up for email alerts
  • RSS

JOURNAL

  • About the journal
  • Editorial board
  • Thank you to our reviewers
  • The American Association for the Surgery of Trauma

AUTHORS

  • Information for authors
  • Submit a paper
  • Track your article
  • Open Access at BMJ

HELP

  • Contact us
  • Reprints
  • Permissions
  • Advertising
  • Feedback form

©Copyright 2022 The American Association for the Surgery of Trauma