Article Text

Abstract
Background Powered, two-wheeled transportation devices like electric bicycles (E-bikes) and scooters are increasingly popular, but little is known about their relative injury risk compared to pedal operated bicycles.
Methods Descriptive and comparative analysis of injury patterns and trends associated with E-bikes, powered scooters and pedal bicycles from 2000 to 2017 using the US National Electronic Injury Surveillance System.
Results While persons injured using E-bikes were more likely to suffer internal injuries (17.1%; 95% CI 5.6 to 28.6) and require hospital admission (OR=2.8, 95% CI 1.3 to 6.1), powered scooter injuries were nearly three times more likely to result in a diagnosis of concussion (3% of scooter injuries vs 0.5% of E-bike injuries). E-bike-related injuries were also more than three times more likely to involve a collision with a pedestrian than either pedal bicycles (OR=3.3, 95% CI 0.5 to 23.6) or powered scooters (OR=3.3, 95% CI 0.3 to 32.9), but there was no evidence that powered scooters were more likely than bicycles to be involved in a collision with a pedestrian (OR=1.0, 95% CI 0.3 to 3.1). While population-based rates of pedal bicycle-related injuries have been decreasing, particularly among children, reported E-bike injuries have been increasing dramatically particularly among older persons.
Conclusions E-bike and powered scooter use and injury patterns differ from more traditional pedal operated bicycles. Efforts to address injury prevention and control are warranted, and further studies examining demographics and hospital resource utilisation are necessary.
- Bicycle
- Descriptive Epidemiology
- Epidemiology
- Surveys
Statistics from Altmetric.com
Introduction
E-bikes and powered scooters enable users to travel longer distances than conventional bicycles or scooters, presenting an attractive method of transportation to school and work as well as for leisure.1 2 They may also reduce the number of cars on the roads, providing a cleaner alternative stemming from their low energy consumption. But, the increasing popularity of electric powered, two-wheeled transportation vehicles like scooters and E-bikes has raised concerns about the potential for injury to riders and pedestrians.3 While the risks of some niche vehicles like powered hover boards have been established in the USA4 5 and have prompted recommendations discouraging their use, particularly for children,6 injury patterns, trends and risks of powered two-wheel vehicles are less clear.
There are some international data available. In Israel, there was a sixfold increase in the number of injured patients due to E-bike and powered scooter incidents from 2013 to 2015.7 In China, the E-bike-related nonfatal injury rate increased almost fourfold and the mortality rate increased sixfold from 2004 to 2010.8 In a second study from China that aimed to describe riding behaviours among E-bike riders, it was found that 26.6% of 18 150 E-bike riders observed did not comply with the road rules, including running red lights, riding in the opposite direction and riding in motor vehicle lanes.9
Evidence in the USA is sparser. In the US in 2000, there were an estimated 4390 hospital emergency department injury admissions associated with powered scooters, representing a more than 200% increase over the 1999 estimate of 1330 injuries.10 11 More recently, the city of Austin, Texas, completed a 3-month dockless electric scooter-related injuries study which showed that for the nearly one million scooter trips during the study period, there were 20 individuals injured per 100 000 scooter trips taken. Approximately half of injured users had an injury characterised as severe, with 84% of those being fractures.12
While the implications of these forms of transportation for public health and safety are becoming increasingly clear, there have been few, if any, large population-based public health studies of the issue. In this report, we present descriptive and comparative analysis of injury patterns and trends associated with electric bicycles (E-bikes), powered scooters and pedal bicycles from 2000 to 2017 using the US National Electronic Injury Surveillance System (NEISS). The results can help inform discussions about the rational allocation of space and resources as communities contend with the health and economic implications of these transportation modes.
Methods
Data were obtained from the US Consumer Product Safety Commission NEISS in Excel format using the Archived Annual NEISS Data query system,13 saved as comma separated value files and read into R as data frames. Files were combined across years. An indicator variable for all powered two-wheeled scooters was created using the product code 5042, which is defined by NEISS as ‘Standup scooter/skateboard, powered’. The code explicitly excludes unpowered skateboards, unpowered standup scooters, personal transporters, motorbikes, mopeds, electric bicycles or any powered vehicle with three or more wheels, but may capture products like Segways. To increase the specificity of the variable, the narrative sections for observations falling under this code were electronically searched for observations containing the term ‘scooter’, but excluding terms for skateboards (‘skate—skate board—skateboard’) and hover boards (‘hoverboard—hooverboard—hover board—hoover board—hoverbaord—hooverbaord—hover boad—hoverboad,—hoverbrd’). Injuries due to electronic bikes were identified by searching for word strings beginning with ‘elect’ or ‘batt’ in the narratives of observations matching product codes for powered bicycles (codes 5035 and 3215). Non-powered bicycles were identified by codes for bicycles (code 5040) and mountain bikes (code 5033).
In addition to demographic variables available in the raw data, indicator variables were created for death, hospitalisations, concussions, internal organ injuries (which may include severe traumatic brain injuries), factures and soft-tissue injuries (strain, sprain, contusion, abrasion, laceration). A variable for collision with a motor vehicle was created by searching narratives for the terms ‘car’, ‘vehicle’, ‘truck’, ‘bus’ or ‘SUV’. Another indicator variable was created for a collision with a pedestrian by searching for the term ‘pedestrian’. Ages were categorised into all-age groups (younger than 18, 18–44, 45–64, 65–84 and older than 84) and paediatric age groups (younger than 5, 5–9, 10–14, 15–19 and older than 19 or adult). These age categorisations are consistent with available census data to calculate population-based rates.
All analyses were conducted in the R statistical programming language. Stratified, weighted, nested, year-adjusted survey estimates were calculated using the R package ‘survey’. Single-year estimates of survey counts were verified against NEISS online-query system estimates to ensure correct survey adjustments. Descriptive analyses consisted of total count of powered scooter injuries, proportion of total reported injuries, mean age and proportion by age group, gender estimates, proportion of injury types, deaths, hospital admissions and injuries involving collisions with motor vehicles or pedestrians. Odds Ratios (OR) to estimate the strength of associations between binomial outcome variables for powered scooter-related injuries versus E-bike-related injuries were calculated using survey adjusted general linear models with a logit link. Trends were evaluated by plotting yearly rates of injury counts per yearly census population estimates.
Results
Demographics
There were a total of 245 885 514 (95% CI 238 381 076 to 253 389 952) injuries reported to the NEISS during the 18-year study period of 2000 to 2017. During that time period, there were 130,797-powered scooter injuries (95% CI 121 528 to 140 065) identified in the data set, accounting for 5.3 injuries (95% CI 5.0 to 5.7) per 10 000 total US emergency department injuries seen during those 18 years. There were a total of 3075 (95% CI 1993 to 4156) E-bike injuries identified, accounting for 0.13 injuries (95% CI 0.08 to 0.17) per 10 000 total US emergency department injuries. By contrast, there were 9 477 600 reported pedal bicycle injuries (95% CI 9 060 922 to 9 894 279) accounting for 385.4 per 10 000 (95% CI 375.7 to 395.2) total emergency department injuries.
The mean age of a person injured using a powered scooter was 29.4 (95% CI 28.0 to 30.8) compared with a mean age of 31.9 (95% CI 27.0 to 36.8) for persons injured using an E-bike and a mean age of 25.2 (95% CI 24.7 to 25.7) for bicycles. The overall age group distribution for pedal bicycle and powered scooter injuries skewed notably younger than that for E-bike injuries (figure 1). The youngest patients accounted for 49.1% (95% CI 46.2 to 52.1) of all powered scooter injuries. By contrast, the largest representative age groups for E-bike injuries were the 18–44 and 45–65 year old groups, who accounted for 40.9% (95% CI 27.8 to 54.0) and 28.6 (95% CI 17.9 to 39.4) of all injuries respectively. Among the paediatric age groups, 10–14 year olds accounted for most powered scooter injuries. For all ages, persons injured using E-bikes were significantly (p=0.0003) more likely to be male (83.3%, 95% CI 71.7 to 95.0) than persons injured using powered scooters (60.0%, 95% CI 57.9 to 62.2). By contrast, 72.4% (95% CI 72.0 to 72.9) of all-age pedal bicycle-related injuries were among males.
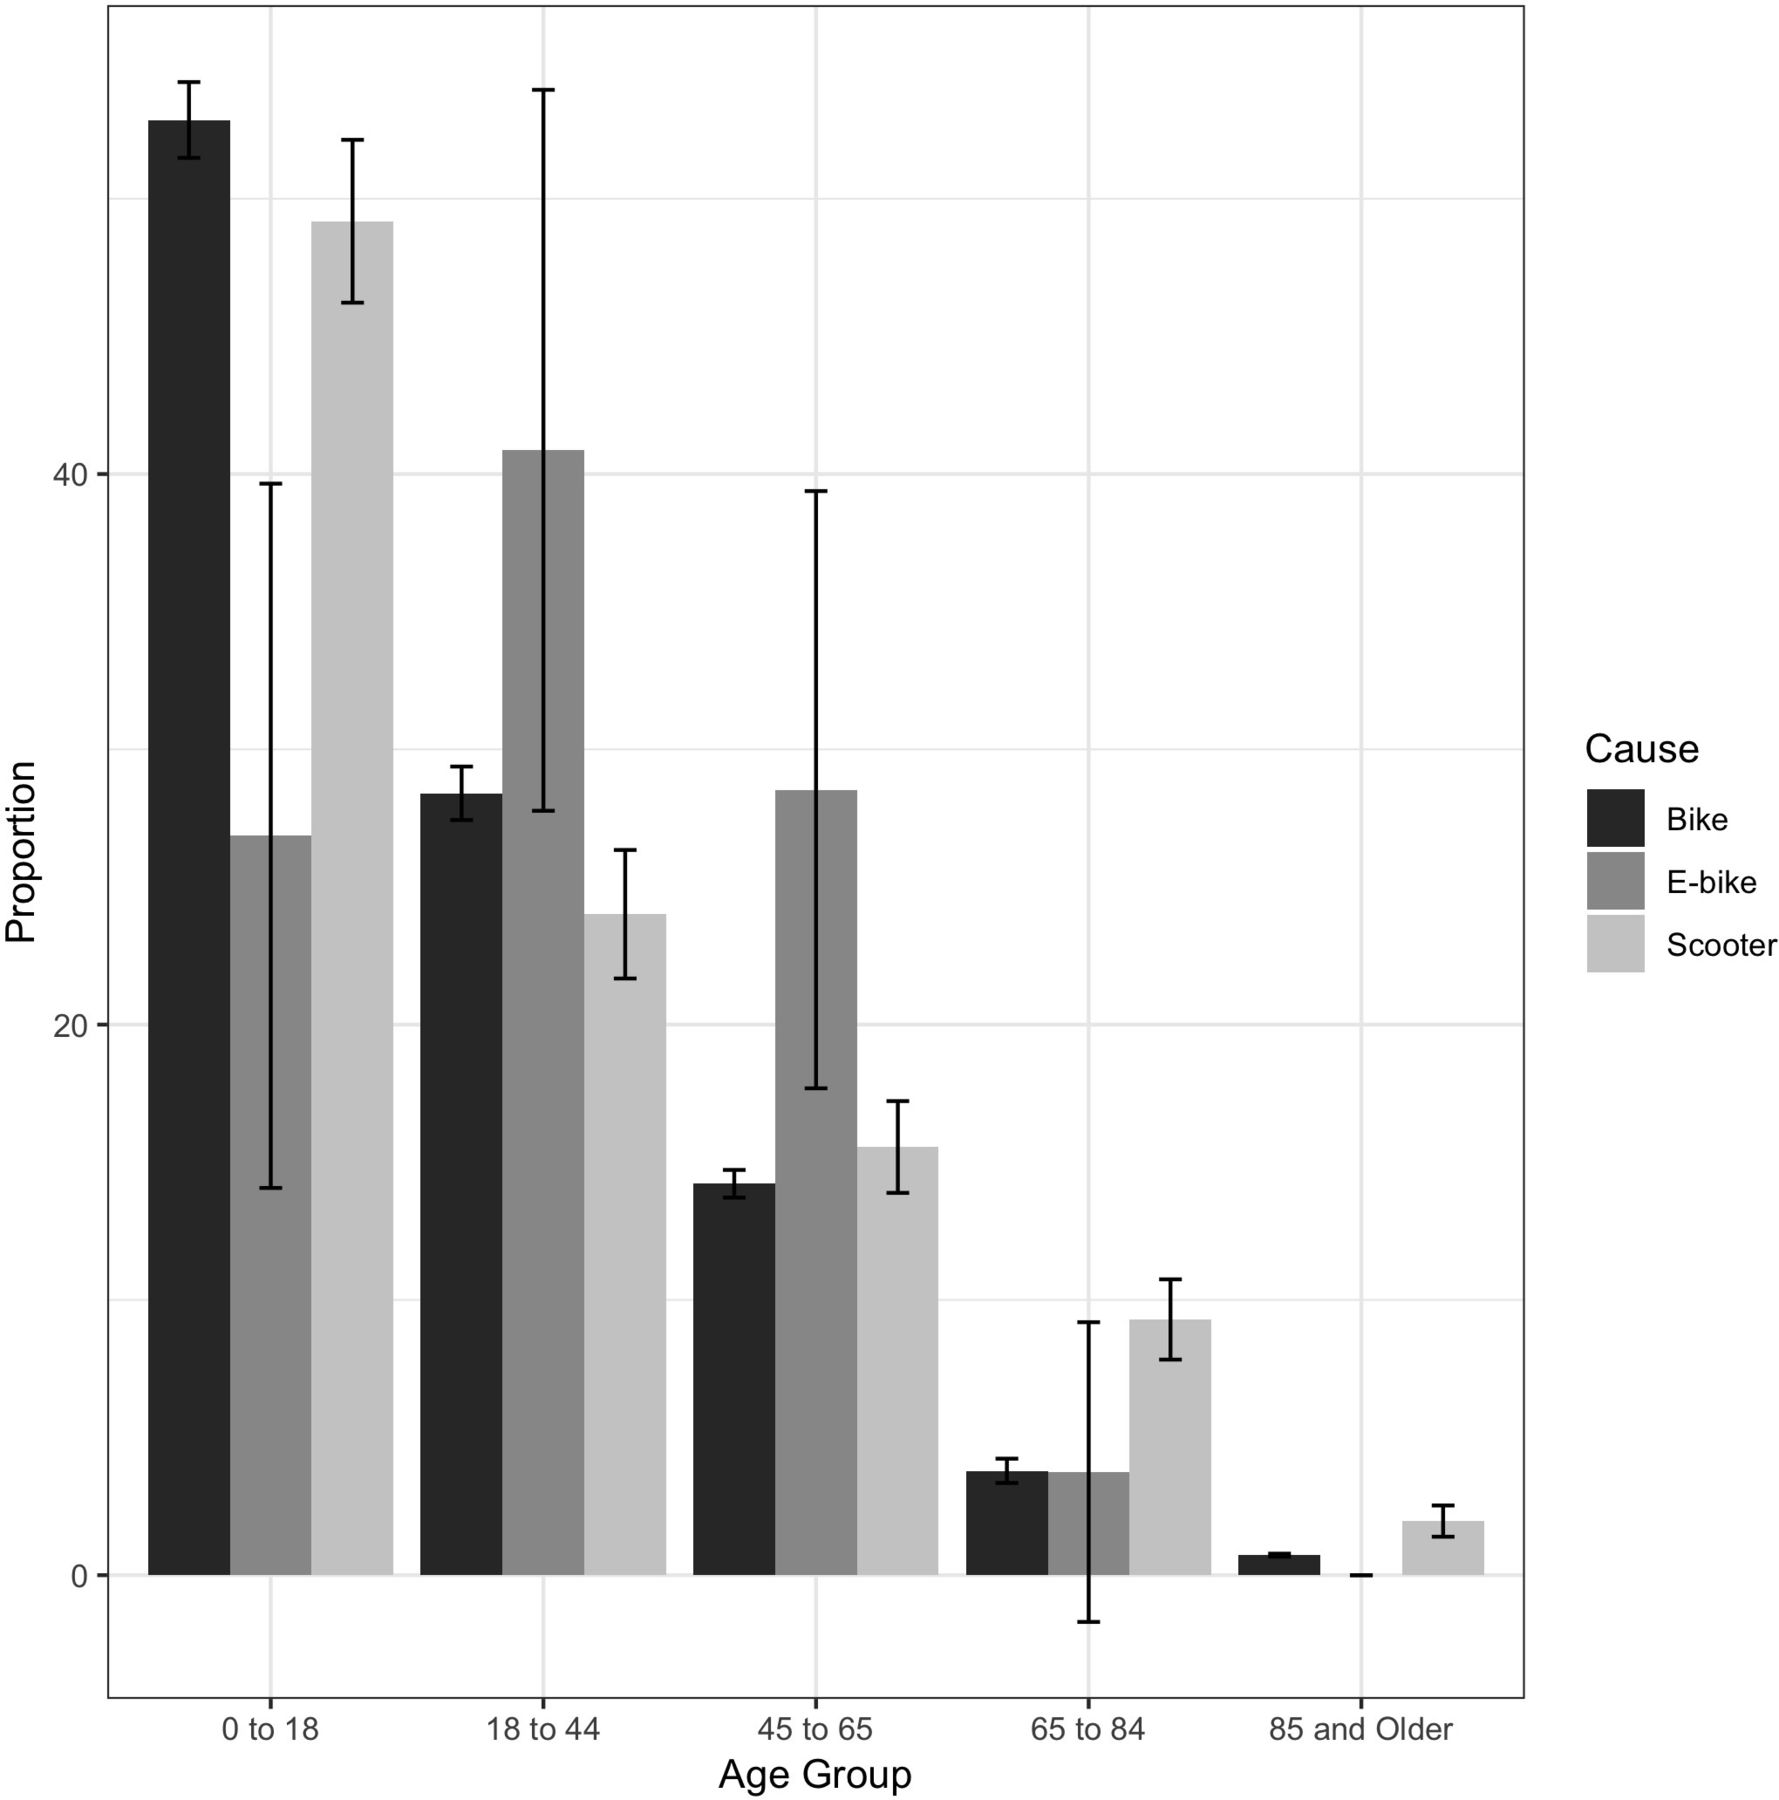
Proportions and 95% CIs of injuries due to pedal bicycles, electric bicycles and powered scooters by age group. National Electronic Injury Surveillance System, 2000–2017.
Types of injuries
Clinical outcomes varied in meaningful and significant ways across injury mechanisms. Most pedal bicycle-related injuries were described as soft-tissue (56.6%, 95% CI 27.4 to 52.6), as were most powered scooter-related injuries (53.6%, 95% CI 51.3 to 55.8). By contrast, 26.5% (95% CI 24.6 to 28.5) of powered scooter injuries resulted in fractures (table 1). In a comparison of injury types due to powered scooters versus E-bikes, powered scooters were nearly three times more likely to result in a diagnosis of concussion (3% of scooter injuries vs 0.5% of E-bike injuries) and notably more likely to result in fractures (26.5% vs 19.6%), while E-bike-related emergency department visits were more than twice as likely to involve internal injuries (17.1% vs 7.5%).
Per cent and 95% CIs for types of injuries due to pedal bicycles, electric bicycles and powered scooters (National Electronic Injury Surveillance System, 2000–2017)
E-bike-related injuries were significantly more likely to involve a motor vehicle than either powered scooters or bicycles. In a survey-adjusted simple logistic regression model, compared with powered scooter injuries, E-bike-related injuries were nearly three times more likely to be the result of a collision with a motor vehicle (OR=2.9, 95% CI 1.7 to 5.0) and three times more likely to be severe enough to require hospital admission (OR=2.8, 95% CI 1.3 to 6.1). Compared with pedal operated bicycles, E-bike-related injuries were over twice as likely to involve a collision with a motor vehicle. (OR=2.3, 95% CI 1.3 to 1.1) E-bike-related injuries were also more than three times more likely to involve a collision with a pedestrian when compared with powered scooters (OR=3.3, 95% CI 0.3 to 32.9) or bicycles (OR=3.3, 95% CI 0.5 to 23.6), although these results did not reach statistical significance (p value 0.3 and 0.2, respectively). There was no evidence that powered scooters were more likely than bicycles to be involved in a collision with a pedestrian (OR=1.0, 95% CI 0.3 to 3.1).
Trends
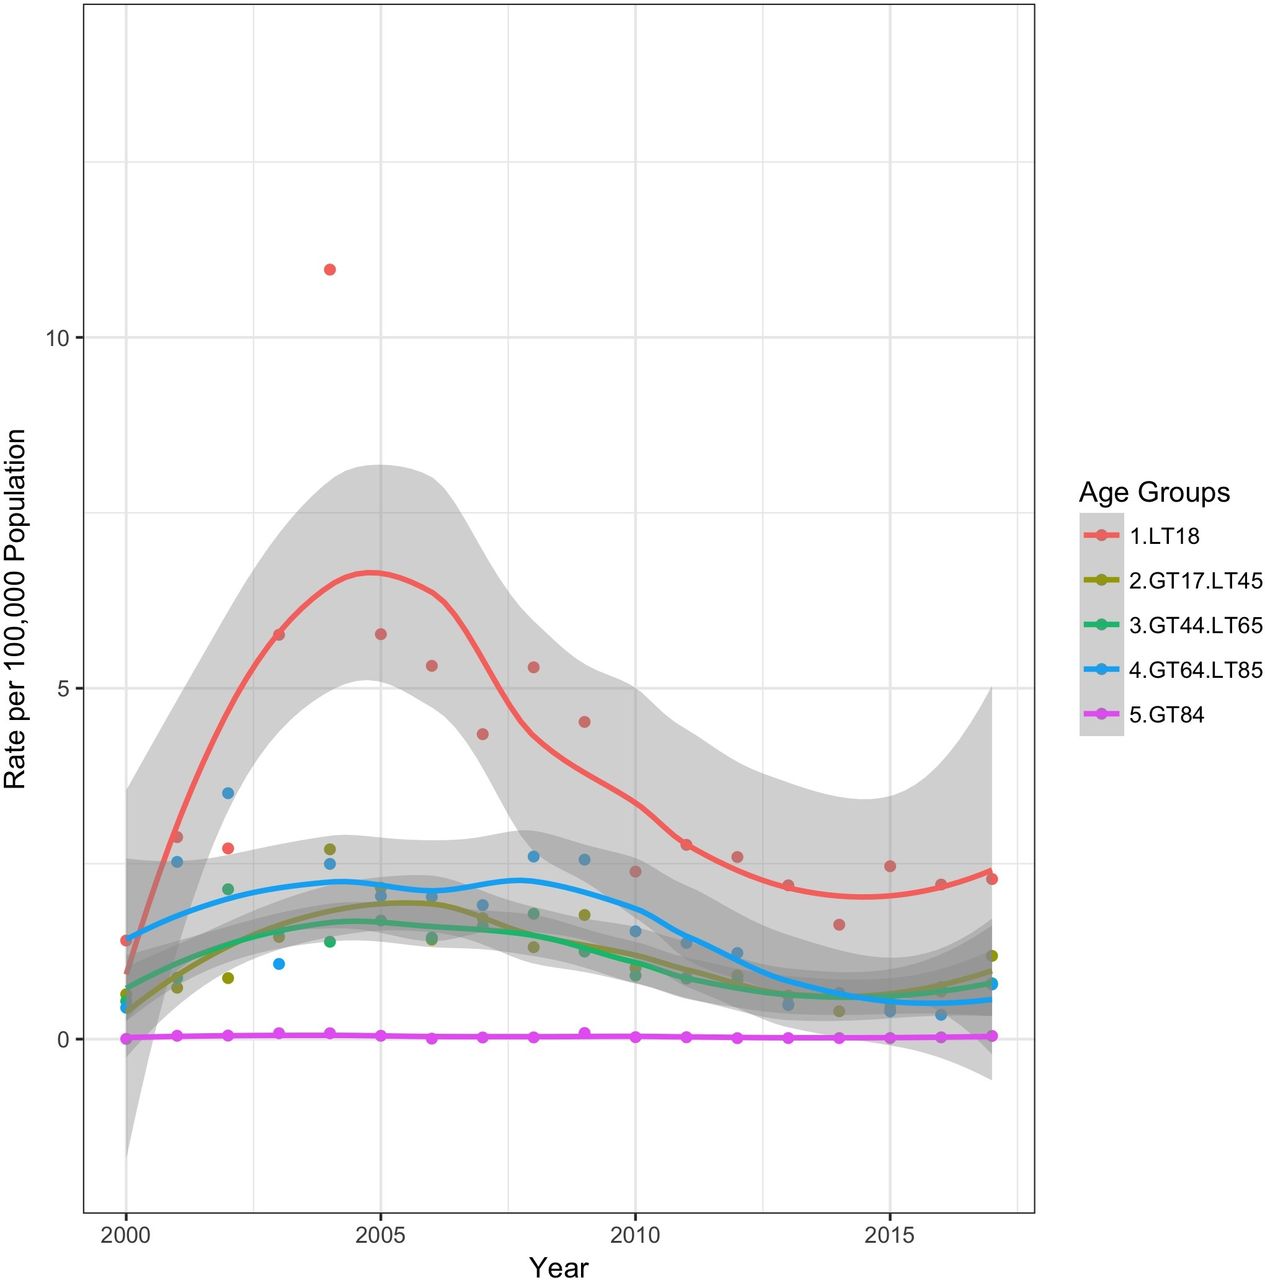
There was a precipitous increase in the population-based rate of E-bike-related injuries in US emergency departments in the period following 2013. (figure 2) Prior to 2013, the highest rates of E-bike injuries were among children younger than 18 (figure 3) Persons injured using E-bikes became notably older over time. The mean age of a person injured using an E-bike increased from 22.8 (SE=3.6) years before 2013 to 37.7 (SE=3.1) after 2013. The population-based rate of powered scooter-related injuries treated in US emergency departments was variable over time but characterised primarily by injuries to children. (figure 4) In stark contrast to the trends for E-bikes and powered scooters, pedal bicycle-related injuries decreased for all age groups following 2009. There was a particularly dramatic decrease in the rates of such injuries for children after 2004. (figure 5)

Yearly rate of E-bike injuries treated in US emergency departments per 100 000 total US population. National Electronic Injury Surveillance System, 2000–2017.

Yearly rate of E-bike injuries treated in US emergency departments per 100 000 US population by age group. National Electronic Injury Surveillance System, 2000–2017.
Yearly rate of powered scooter injuries treated in US emergency departments per 100 000 US population by age group. National Electronic Injury Surveillance System, 2000–2017.

Yearly rate of pedal bicycle-related injuries treated in US emergency departments per 100 000 US population by age group. National Electronic Injury Surveillance System, 2000–2017.
Discussion
Over the past 40 years, transportation technology has produced a myriad of recreational vehicles and, with each new device, evidence almost invariably follows describing the dangers of use without proper safety precautions. After evidence accumulated on the dangers of inline skating and non-powered scooters, the American Academy of Pediatrics issued cautionary statements about their use by children.14 Now attention has turned to a new class of two-wheeled, powered devices. This issue may be of even greater concern than that associated with past devices.
Worldwide, estimated annual E-bike sales continue to grow, from 31 million units sold in 2012 to 47.6 million by 2018.15 Although sales in North America are difficult to track, an estimated increase from 80 000 sold in the US in 2011 to 200 000 in 2013 has been reported.16 But perhaps the greatest cause for considering the possibility of increased injuries to users and passers-by is the advent of powered bicycle and scooter sharing programmes that do not require docking stations.
Our analyses indicate that while there is some nuance and complexity to the injury picture for these vehicles, there is cause for concern. Injury patterns for E-bike and powered scooters differ from each other and from traditional pedal operated bicycles in ways that will demand increased attention from transportation and public health officials. Persons injured using E-bikes were considerably older and much more likely to be male, consistent with their increasing use for commercial deliveries, especially food, in many urban settings and possibly for their use by older persons needing a powered/electronic mobility device.17 Older age and commercial use may account in part for the greater likelihood of injuries severe enough to require hospital admission and the nearly threefold increased risk of collision with a motor vehicle. It is important to note that personal mobility devices may have important implications not only for sustainable transport,18 but for individual well-being, particularly for older adults.19 Introducing them widely in a safe and responsible manner may require rethinking aspects of urban design and built environment.20
The increased proportion of concussions associated with powered scooters may seem paradoxical in the context of this overall increased severity associated with E-bikes. We can only speculate that this may be due, at least in part, to the use of helmets by E-bike users. While E-bikes themselves remain illegal in cities like New York, delivery cyclists are required to wear helmets.21 A similar requirement for powered scooters may very well be in order.
With regard to powered scooters, we believe our clinical results are roughly consistent with those in the City of Austin, Texas in the U.S.22 A direct comparison is not possible, but we similarly present a large proportion of soft tissue injuries and fractures, and the 7% proportion of traumatic brain injuries (TBI) among the Austin group categorised as severely injured is on a par with the 3% we report among all emergency department discharges.
Our results add to and enhance this evidence base by putting the results in the context of the more well-described and accepted used of pedal-powered bicycles. While the overall numbers and trends are strikingly different, broadly speaking motorised scooter injuries appear to be more similar to pedal-operated bicycle injuries than to E-bike injuries. Notably, our analyses do not support the common anecdotal observations and fears of pedestrians being struck by powered scooters, at least when compared with pedal powered bicycles. By contrast, E-bikes appear relatively riskier to both riders and pedestrians than either powered scooters or pedal bicycles.
Our results are, though, subject to a number of important limitations and caveats, and as is so often the case, this observational study serves more to highlight the need for additional information than as a conclusive review. Our data were missing several key demographics such as race, insurance status and helmet use, which are important for education and injury prevention. From a clinical perspective, we also had no documentation of the level of injury severity or the amount of hospital resource utilisation required (ie, intensive care unit admissions, length of stay, need for operation). Perhaps most importantly, we have no longer-term outcome data such as death or disability. Additional analyses of more clinically informed administrative data like the National Trauma Data Bank can serve as a straightforward next step to help complement and fill in missing areas of this research and perhaps justify the need for prospective studies.
Like many injury studies, our analyses are population-based rather than exposure-based, and the results are as much a reflection of the popularity of these devices as they are of inherent or comparable risk. Ideally, our denominator would have been based on person-miles travelled. There is a need for a more accurate measure of risk, such as observational studies using data from ride share companies like Bird and Lemon or primary data collection at point of care like emergency departments and trauma centres. Also, it is very likely that these national-level results vary in important ways across localities. While these results establish a useful baseline against which to measure analyses of smaller geographic areas, those small-area analyses are necessary to establish the most relevant evidence for municipalities considering how best to address the issues associated with these devices.
Large observational data like NEISS have been estimated to be approximately 89%–98% accurate,22 23 but our results may be subject to greater measurement error. In the NEISS system concussions, which are generally less severe, are coded separately from more severe traumatic brain injuries, which are included under ‘internal injury’.24 And, because NEISS does not contain codes specific to E-bikes and electric powered scooters, and the code for E-bikes and electric powered scooters captures injuries due to personal transports like Segways,25 we used search terms to identify them. This approach may have been overly conservative in the case of E-bikes. While it was effective in excluding gas-powered motor bikes, it likely resulted in an under count of E-bike-related injuries. We believe, though, that any measurement error in this analysis is not likely to contribute to incorrect relative estimates or misleading time series. So, for example, while the absolute number of children injured using E-bikes is probably higher than we report, the decline in the number of those injuries in that age group following 2005–2006 is reliably real.
We conclude that while electric-powered two-wheeled devices like E-bikes and powered scooters represent new opportunities for transportation and more active mobility, there are important health and safety challenges. Their benefits in terms of environmentally friendlier, sustainable transportation are attractive, but their use carries undeniable injury risks. The more that is known, the better communities can control those risks while retaining the benefits.
What is already known on the subject
Electric-powered bicycles and scooters are increasingly popular.
There are reports of injuries when they are introduced into a community.
What this study adds
The incidence of severe injury associated with these modes of transportation have been increasing across the USA.
Injuries associated with electric-powered bicycles are characterised as ‘internal’ and more likely to be associated with hospital admission than traditional pedal-operated bicycles.
Powered scooters are more likely to result in concussions than pedal-operated bicycles.
Footnotes
Funding This study was funded by National Institute of Child Health and Human Development (Grant number: R01-HD087460).
Competing interests None declared.
Patient consent for publication Not required.
Provenance and peer review Not commissioned; externally peer reviewed.
Data availability statement Data are available in a public, open access repository.