Article Text

Abstract
Background: The report of the CUSUM across surgical and interventional procedures has spawned a fair confusion in the literature.
Aim: To assess the use of the CUSUM and to clarify its utilisation in the perspective of future studies.
Nature of the study: Retrospective review.
Methods: A systematic literature search of Medline was carried out. From each article, data regarding the design of the study, the specialty, the performance criterion, the unit under control, the methodology and the model of the CUSUM used, the use of a graph, the use of a test and the type of test applied were retrieved.
Results: 31 studies were found relevant. The design was mainly retrospective for the analysis of the learning curve. The main performance criteria under control were morbidity, mortality and success of the procedure. A graph was plotted in all studies as a CUSUM plot or as cumulative sums of non-negative values. A test was used in 17 studies. Mislabelling of the plot and the test, and misuse of control limits were the most commonly reported mistakes.
Conclusion: The CUSUM tool is not yet properly reported in the surgical literature. Therefore, reporting of the CUSUM should be clarified and standardised before its use widens.
- SPRT, sequential probability ratio test
Statistics from Altmetric.com
Quality control in medicine has generated considerable interest in the past decade issuing from public health authorities, doctors or patients themselves.1–3 The case of the general practitioner Harold Shipman and the Bristol Royal Infirmary Inquiry have brought the need for monitoring clinical performance into focus.4 More recently, it has found an important application in the control of surgical procedures, either in analysing the learning curve of a technique or in controlling a run of interventions.5–7 Lately, applications have been sought for controlling new technologies as they are initiated.8
The most commonly used methods of statistical process control are the Shewart chart, the sequential probability ratio test (SPRT), the exponentially weighted moving average and the cumulative sums (CUSUMs).4,9 Among all, the CUSUM has attracted more attention and disseminated in the medical literature due to its simple formulation and an intuitive representation, and to its capability of detecting small persistent changes.10,11 Numerous review papers have discussed methodological and statistical issues, and have given guidelines to perform such analyses.12,13 However, as for any new tool, its application spawns a fair confusion and, to the best of our knowledge, no one has yet reviewed how the CUSUM tool was, in fact, used across interventional and surgical literatures. Our aim was to bridge the gap between what should be done and what is actually done in the literature.
The objectives of the present work were to review the use of the CUSUM across different interventional and surgical specialities, and to clarify its use in the perspective of future studies.
MATERIALS AND METHODS
We performed a systematic literature search of Medline with the search terms “CUSUM or cumulative sums” and “surgery or procedure” on 15 March 2006, supplemented by cross-bibliographic checks of reference lists. No restrictions were made regarding date of publication, language or publication status.
To be included in the review, studies had to analyse a manual procedure, surgical or other, by using the use of the CUSUM. Worked examples, methodological and statistical reviews were excluded.
Data retrieved from each article were: date of publication, specialty, objective (analysis of the learning curve or quality control) and design (retrospective or prospective) of the study, performance criterion (mortality, morbidity, success of the procedure, and so on), series size, numbers and types of units under control (care provider or centre), and the basis for definition of the reference value.
Data from the methodology and the applied model of the CUSUM were also recorded: the use of a graph as a CUSUM graph or as a CUSUM of non-negative values; the use of a test (control limits or boundary lines) and the type of the applied test (CUSUM or SPRT); the reporting of enough information in the study to compute the graph if data were available; and the adjustment for patient’s individual risk factors.
Different statistical methods have been used for continuous monitoring of a process: the CUSUM graph, the CUSUM test and the SPRT are the most commonly used methods (see Appendix).
The CUSUM graph should be differentiated from the CUSUM test, or tabular CUSUM. The CUSUM graph plots the cumulative sums of the deviation between the process and a target value. The graph provides a qualitative overview of the processed monitored (fig 1A). The CUSUM test is a hypothesis test that relies on the comparison between computed values and a limit.14 It has a graphical representation where one plots the cumulative sums of the maximum between zero and a weighted value (sample weight) (figs 1B, 2A). When the graph hits the limit, the process is claimed to be out of control, but it can never be considered as definitely in control. On the contrary, an inverted CUSUM is drawn below the zero horizontal axis and is used to detect quality improvements. A two-sided CUSUM test allows detecting the deviation above or below a target when both are considered as suboptimal performances.

(A) A CUSUM graph and (B) a CUSUM test for monitoring limb alignment of total knee replacement using CT-based navigation system.8 The CUSUM graph shows that learning curve lasted for the first 27 implants and then stabilised around the 180° axis (the target value). The CUSUM test shows that control of the process was maintained during the entire study. As limb alignment may deviate above or below the target value, two CUSUM tests (one positive and one negative) are drawn simultaneously with symmetric definition. Each has a control limit set at 3.6 (+ or −depending on the CUSUM) and the same holding barrier at 0.
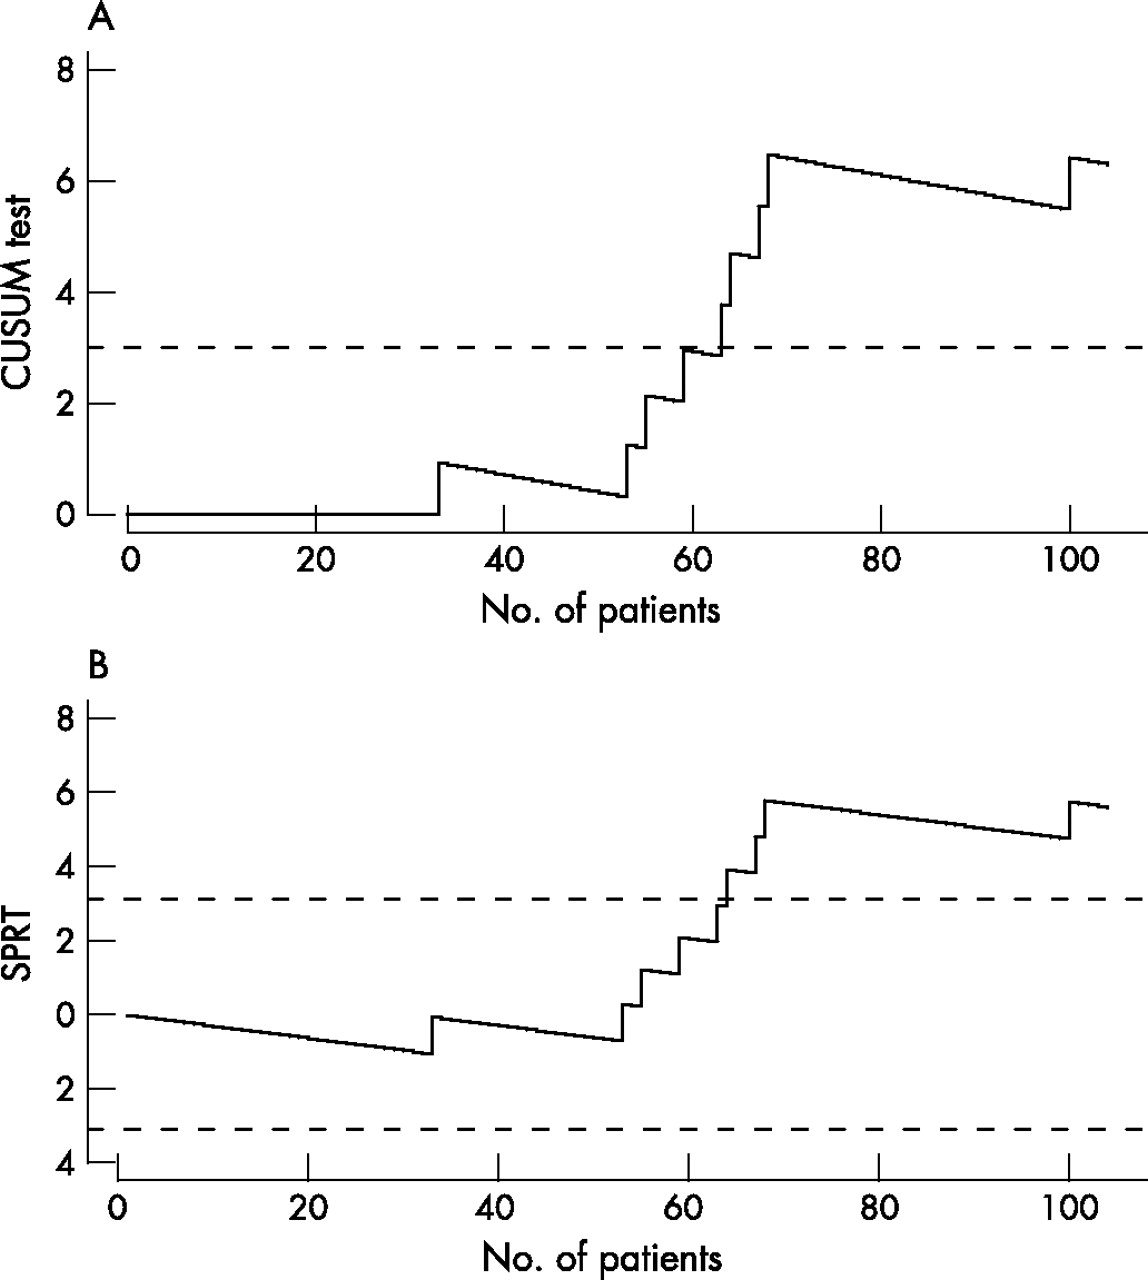
(A) A CUSUM test for monitoring death after paediatric cardiac operation.3 The test detected a cluster of surgical failures starting with patient 53. A comparison is drawn between the CUSUM test and (B) the sequential probability ratio test (SPRT). The CUSUM test has only an upper boundary line (out of control), whereas the SPRT has both an upper (out of control) and a lower (in control) boundary lines. A signal is triggered with the SPRT just one observation later than that with the CUSUM test. It seems that both methods are close in terms of calculation, but have somewhat different purposes. Some confusion has arisen in the literature, due to the fact that a SPRT is actually a cumulative sum.
The SPRT is a hypothesis test in itself and a graphical representation could be displayed (fig 2B). The SPRT presents two limits, an upper boundary line where one chooses to accept the alternative hypothesis (the process is in control) and a lower boundary line where one chooses to accept the null hypothesis.
A more detailed description of the use of the CUSUM can be found in dedicated reviews and are beyond the scope of this paper.12,13
RESULTS
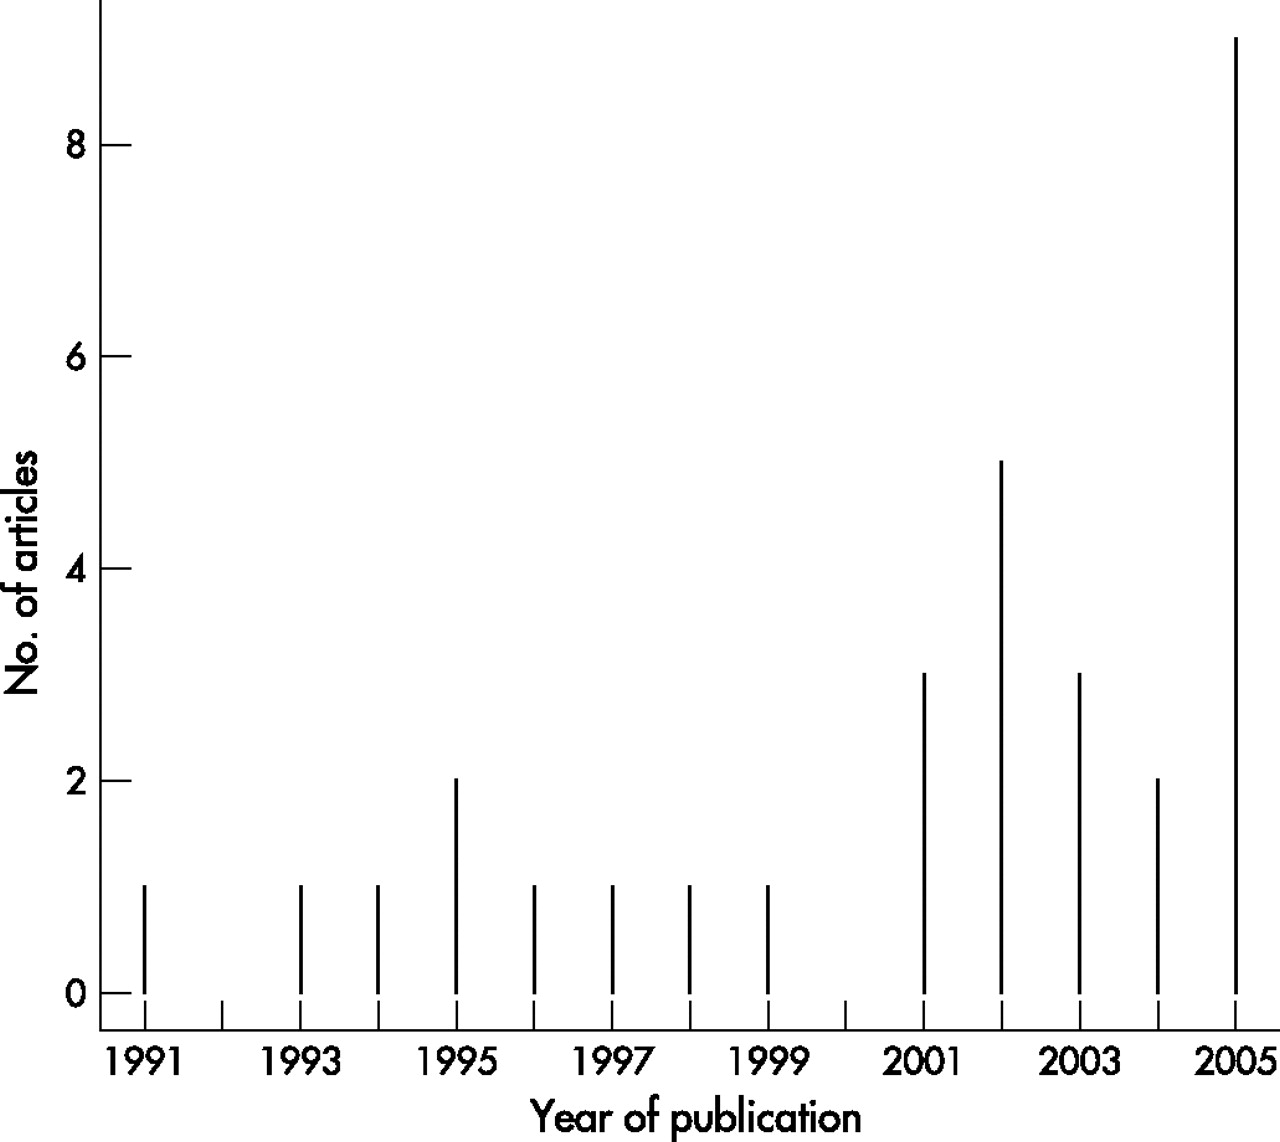
The search strategy generated 77 studies. In all, 31 studies were found relevant by title, abstract and on final complete retrieval of the article (table 1). Publication years ranged from 1991 to 2005, with a recent increase in the number of publications (fig 3). In all, nine studies were from Canada, eight from the UK, four from New Zealand, three from USA, two from France; and one publication each from five other countries.
Studies using the CUSUM as an evaluation tool for interventional and surgical procedures

The number of publications per year for procedures that are using the cumulative sum for the control of surgical or interventional procedures.
The design was retrospective in 25 (80%) studies and prospective in 6 (20%); the objective was the analysis of the learning curve in 22 (71%) studies, quality control in 8 (26%) and both in 1 (3%) study. Specialties of interest were cardiovascular surgery in 14 (45%) studies, anaesthesia in 7 (23%), general surgery in 4 (13%), endoscopy in 3 (10%), otolaryngology-head and neck surgery in 2 (6%) and orthopaedics in 1 (3%). The unit under control was the care provider in 22 (71%) studies and the centre in 9 (29%); the number of units under control per study ranged from 1 to 20. The median (range) number of procedures controlled per study was 299 (24–3983).
The main performance criterion under control was morbidity in 1 (3%) study, mortality in 7 (23%), mortality and morbidity in 7 (23%), and the success of the procedure in 16 (52%). The success of the procedure was defined as completion of the procedure, a procedure meeting the required standard or a procedure completed within a certain time. The data monitored was binomial in 28 (90%) studies and normally distributed in 3 (10%) studies. Target and failure rates were determined from consensus in the department in 5 (16%) studies, from reported rates in the literature in 9 (29%), from expert society requirements in 4 (13%) studies and from the observation during the monitoring of the procedure in 5 (16%). The basis for definition of target and failure rates was not reported in 7 (23%) studies.
A graph was plotted in all studies, but it was incorrectly labelled as “cumulative failures” in 2 (6%) studies; the plot was a CUSUM graph in 28 (90%) studies and a cumulative sum of non-negative values in 3 (10%). A test was applied in 17 (55%) studies: 7 (41%) studies were SPRT, 6 of which were wrongly reported as CUSUM tests; 5 (29%) were standard CUSUM graphs with limits derived from a SPRT (ascending limits); 3 (18%) were CUSUM tests; 1 (6%) was the observed–expected cumulative values; and in 1 (6%) study, the boundary lines on the CUSUM graph were flat although they should have been ascending as the limits were those of a SPRT. Sufficient explanation for computing the CUSUM was given in 26 (84%) studies and the CUSUM was risk adjusted in 7 (23%) studies.
DISCUSSION
Statistical process control has emerged in the medical literature after a wide expansion in the industry.15 In the 1920s, Shewart,16 who worked for Bell Telephone Laboratories, constituted a group of experts and established the scientific ground for quality control. Statistical process control and control charts emerged later, with Wald,17 who first developed the theory of SPRTs, and with Page14 who developed the CUSUM chart in the mid-1950s. Control charts proved very useful to quality management in the industry and disseminated rapidly. Although the first publication of CUSUM in a general medical journal dates back to the mid-1970s,18 its strong properties have not been exploited due to the confusion that arose in recent years together with the spread of the technique.
The CUSUM graph and the CUSUM test should be differentiated. Moreover, the CUSUM test and SPRT are usually confounded and this has yielded some confusion in the literature.3,19–22 The need for deciding whether a process is out of control requires the use of control limits. Some authors have used standard CUSUM graphs with limits being derived from a SPRT 23–27; however, a SPRT has two absorbing limits, the upper to reject H0 (the process is deemed out of control) and the lower to accept H0 (the process is above the required performance), and it does not make sense to continue monitoring once a limit has been hit.9 Indeed, if one continues plotting after the inferior limit has been hit, the CUSUM graph will build up credits with time and, therefore, it is unable to raise an alarm in due time if the process goes out of control after a period of good performance.25,26 The same applies for the upper limit, be it that of a CUSUM test or that of a SPRT test: when this limit is hit, the plot should be stopped, and the procedure may be investigated.
The CUSUM was usually used for two purposes: assessing a learning curve and quality control. The former has yet again generated more interest. However, the limits should be used with due care. Indeed, many have used a CUSUM test while assessing a learning curve, although it is not well adapted for this purpose.20,26,28 The CUSUM test was originally designed for monitoring a procedure that has reached a steady state, and was not designed to monitor a procedure that is supposed to be out of control from the start. In this case, the upper boundary limit of the CUSUM test is often crossed, sometimes as high as two or three times, and it then makes little sense for setting a limit.20,28 Reaching a steady state on the CUSUM graph may be enough assurance to conclude that the learning curve has settled down. Conversely, for quality control, a lower boundary line accepting the in-control state, as in the SPRT, should not be used. Indeed, for continuous monitoring, when the purpose is the detection of changes that could occur during surveillance, one should never say that a procedure has reached an in-control state and that monitoring can be safely stopped. To avoid this drawback, a resetting SPRT has been developed which resets by itself at 0, each time the lower boundary is hit.9
As for any new statistical tool, the CUSUM would benefit from clarification. Self-contained explanations with adequate referencing to methodological or statistical reviews should be found in the text of each study. Authors willing to use the CUSUM should also clearly report on what was done. The design (retrospective or prospective) and the objective (analysis of learning curve or quality control) of the study, the performance criterion under control (mortality, morbidity, and so on) and how the reference value was determined (consensus from the department, literature, expert society, and so on) should be clearly enunciated in the methodology. The model of the CUSUM that was applied (CUSUM graph and CUSUM test), the type of data that were monitored (binomial, Poisson distribution and normally distributed data) and how the control limits were determined (log-likelihood ratio) should also be clearly enunciated. Statistical considerations are beyond the scope of this work and can be found in specific reviews.4,29 However, with developments of the CUSUM in its prospective purpose, as for continuous monitoring and surveillance, other specific issues will soon arise: the determination of target and reference values, the determination of limits through the average run length and actions that should be taken when an alarm is raised.
Reports from the Institute of Medicine, Washington DC, USA have emphasised the need for building a safer health system.30 Inadequate monitoring of treatment is a cause for error, and the Institute of Medicine encouraged healthcare organisations to develop a culture of safety and create systems for continuously monitoring patient safety.30 The committee later proposed six aims for establishing the 21st century healthcare system and noted that today’s healthcare system functions at far lower level than it can and should be.2 “Timely” was one of these key points and the report notified that “reducing waits and sometimes harmful delays for both those who receive and those who give care” would be far better at meeting patients’ needs. The CUSUM tool has shown its power in detecting, in timely fashion, fatal medical errors, near misses and suboptimal clinical performance. Moreover, initiation of new surgical technologies, whose rapid development may render classic assessment inadequate, could benefit from continuous performance evaluation.8,31
Despite all the confusion in the use of the CUSUM, it is generating more and more interest in the surgical community, and is being handled more appropriately in recent years.8,32,33 Statistical control tools have shown their dramatic potential life-saving impact through the retrospective study of Harold Shipman death certificates and the Royal Bristol infirmary annual mortality rates.4 However, their use in continuous prospective quality control is yet to be expanded. Continuous monitoring of failure rates (mortality after cardiac surgery, recurrence of hernia after repair, and so on) and clinical performance (rate of misses and near misses in cardiac surgery, conversion rate for laparoscopic surgery, and so on) at centre or care provider level would be of enormous help in improving patient care and cost effectiveness.34
CONCLUSION
The use of the CUSUM is generating more and more interest in the medical world and across the surgical community. However, despite extensive reviews on the topic, it is not yet properly reported in the surgical literature and the confusion remains, which may hamper its spread. Therefore, reporting of the CUSUM should be clarified and standardised. The shift from retrospective study and learning curve assessment to prospective quality control is at crossroads and promises great expectations.
APPENDIX
The principle of CUSUM charts was developed for industrial quality control during the 1930s, and drew considerable attention and research during the 1950s. Assume that we wish to continuously monitor a process. The basic idea of CUSUM graphs is to plot the cumulative sum of the deviation between the process and a target value, instead of plotting the sequential values of the process themselves. If we note Xi as the ith measurement of the process and X0 the target value, the CUSUM Cn after the measurement of n has the simple expression: Cn = Σ(Xi–X0). When a target value cannot be defined, some first or last values of the process are taken (usually their mean) to define a target. Another expression of the CUSUM for Bernoulli data may be found where one plots Cn = Σ(Xi–s), where Xi–s is proportional to the log-likelihood ratio.
The CUSUM test is a particular hypothesis test of the null hypothesis H0 “the process is in-control”—that is, the performance is as expected, versus the alternative hypothesis H1 “the process is out of control”—that is, the level of performance has switched to a highly unacceptable level. The CUSUM test has an upper boundary line where one accepts the alternative hypothesis. When the graph hits this limit, the process is then claimed to be out of control. On the other side, it has a holding barrier at 0, which cannot be crossed; when the graph hits this limit it stays at 0 and the monitoring continues. With this procedure, acceptance that the process has reached an in-control state is not possible. This is particularly well suited to quality control, where the process will possibly deviate in the future. For normally distributed data, two CUSUM tests are drawn simultaneously (one positive and one negative).
The sequential probability ratio test (SPRT) is a very close statistical method. However, the SPRT has a negative lower boundary. When it is crossed, enough evidence accumulates to say that the process is in control, and the monitoring should stop. Figure 1 presents an illustration of the CUSUM methodology.
Acknowledgments
We thank Dr Lysbeth Ravn for her help in translating her own manuscript. Her participation does not necessarily mean that she agrees with the content of the manuscript.
REFERENCES
Footnotes
-
Competing interests: None.