

Article Figures & Data
Figures
- Figure 1
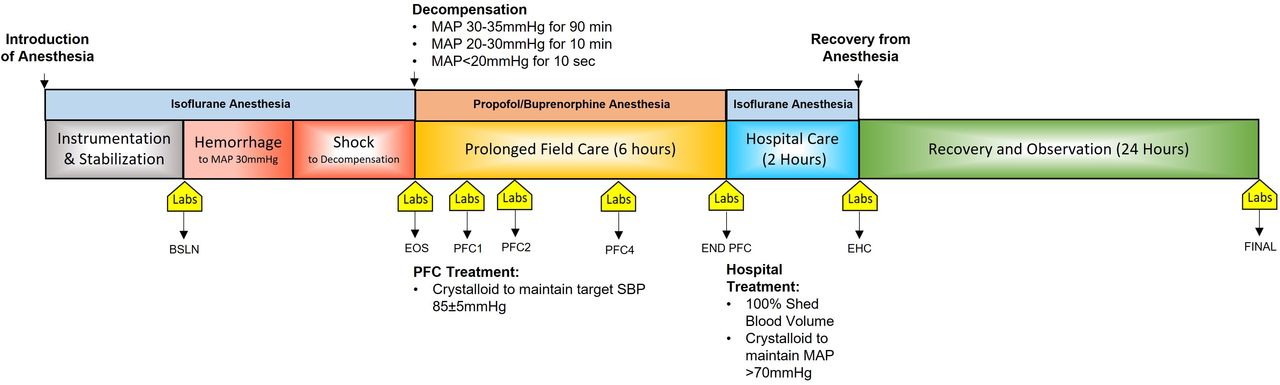
Experimental timeline. Schematic depicting experimental timeline, with time points running from instrumentation, through hemorrhage, prolonged field care (PFC), hospital care, postoperative recovery and observation, and euthanasia. Blood draws were obtained at each indicated time point for labs (complete blood counts, ROTEM, STAGO, and ELISAs) at baseline (BSLN), end of shock (EOS), PFC1, PFC2, PFC4, END PFC, end hospital care (EHC) and euthanasia (FINAL). ELISAs, enzyme-linked immunosorbent assay; MAP, mean arterial pressure; SBP, systolic blood pressure.
- Figure 2
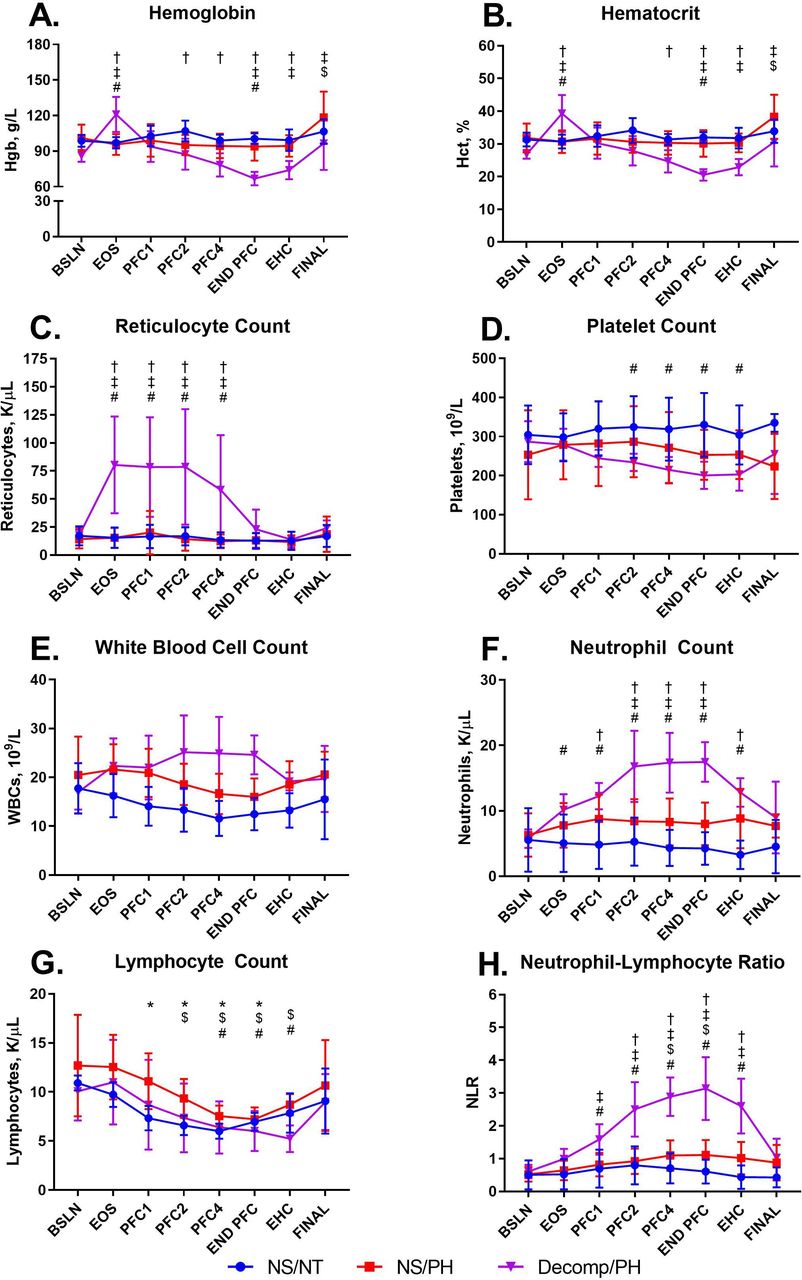
Complete blood count parameters. Complete blood count parameters were measured at all time points. Data are presented as mean±SD for (A) hemoglobin, (B) hematocrit, (C) reticulocyte count, (D) platelet count, (E) white cell count, (F) neutrophil count, and (G) lymphocyte count, (H) neutrophil–lymphocyte ratio. Colors indicate groups: NS/NT, blue; NS/PH, red; Decomp/PH, purple. P values of <0.05 were considered to be statistically significant. Significant differences between groups are indicated as: NS/NT versus Decomp/PH=† and NS/PH versus Decomp/PH=‡. Significant differences relative to BSLN are indicated as: NS/NT=*, NS/PH=$, and Decomp/PH=#. BSLN, baseline; Decomp/PH, decompensated hemorrhage+hypotension; EHC, end of hospital care; END PFC, end of PFC; EOS, end of shock; FINAL, euthanasia; NS/NT, non-shock/normotensive; NS/PH, non-shock/permissive hypotensive; PFC, prolonged field care.
- Figure 3
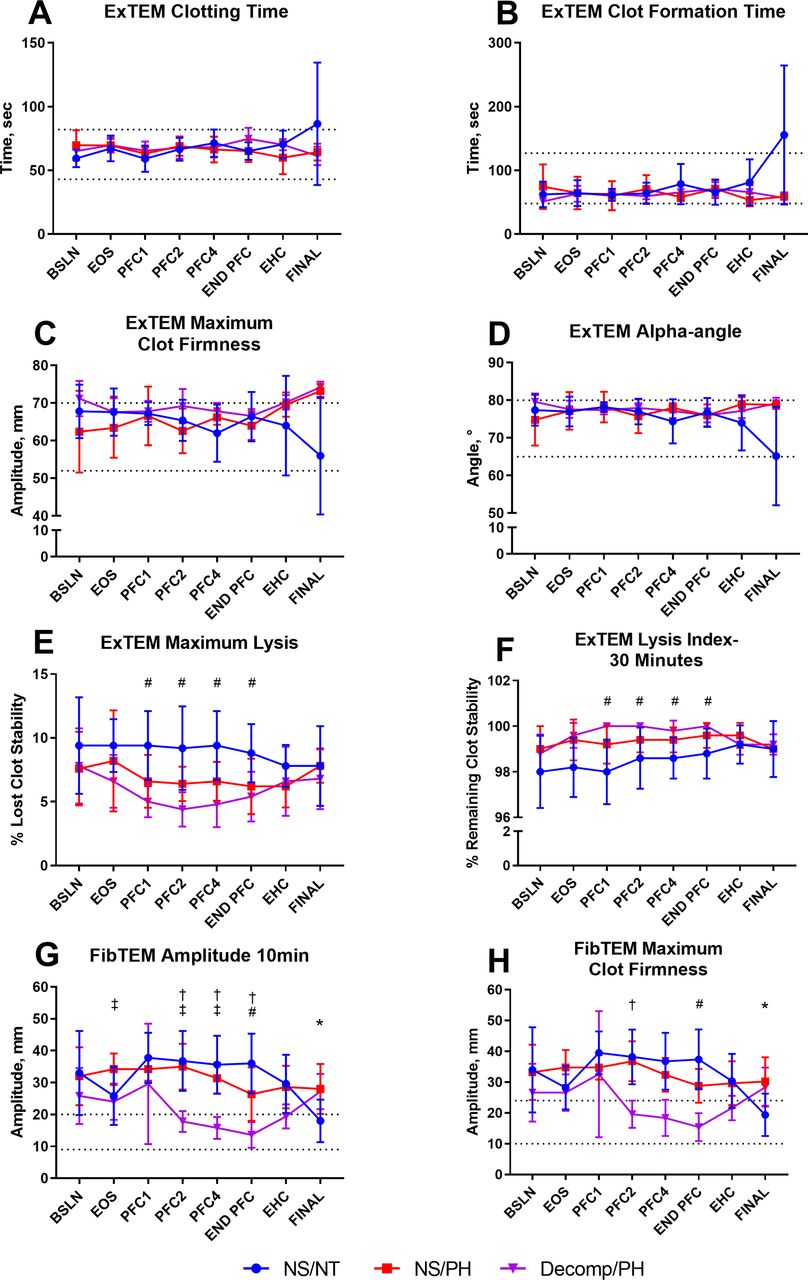
ROTEM parameters. ROTEM parameters were measured at all time points. Data are presented as mean±SD for (A) ExTEM clotting time, (B) ExTEM clot formation time, (C) ExTEM maximum clot firmness, (D) ExTEM alpha-angle, (E) ExTEM maximum lysis, (F) ExTEM Lysis Index-30 Minutes, (G) FibTEM amplitude 10 min, and (H) FibTEM maximum clot firmness. Colors indicate groups: NS/NT, blue; NS/PH, red; Decomp/PH, purple. Dotted lines represent human reference ranges as set forth by ROTEM. P values of <0.05 were considered to be statistically significant. Significant differences between groups are indicated as: NS/NT versus Decomp/PH=† and NS/PH versus Decomp/PH=‡. Significant differences relative to BSLN are indicated as: NS/NT=*, NS/PH=$, and Decomp/PH=#. BSLN, baseline; Decomp/PH, decompensated hemorrhage+hypotension; EHC, end of hospital care; END PFC, end of PFC; EOS, end of shock; FINAL, euthanasia; NS/NT, non-shock/normotensive; NS/PH, non-shock/permissive hypotensive; PFC, prolonged field care.
- Figure 4
STAGO parameters. STAGO parameters were measured at all time points. Data are presented as mean±SD for (A) prothrombin time, (B) D-dimer, (C) fibrinogen, (D) partial thromboplastin time, (E) von Willebrand factor, and (F) antithrombin III. Colors indicate groups: NS/NT, blue; NS/PH, red; Decomp/PH, purple. P values of <0.05 were considered to be statistically significant. Significant differences between groups are indicated as: NS/NT versus Decomp/PH=† and NS/PH versus Decomp/PH=‡. Significant differences relative to BSLN are indicated as: NS/NT=*, NS/PH=$, and Decomp/PH=#. BSLN, baseline; Decomp/PH, decompensated hemorrhage+hypotension; EHC, end of hospital care; END PFC, end of PFC; EOS, end of shock; FINAL, euthanasia; NS/NT, non-shock/normotensive; NS/PH, non-shock/permissive hypotensive; PFC, prolonged field care.
- Figure 5
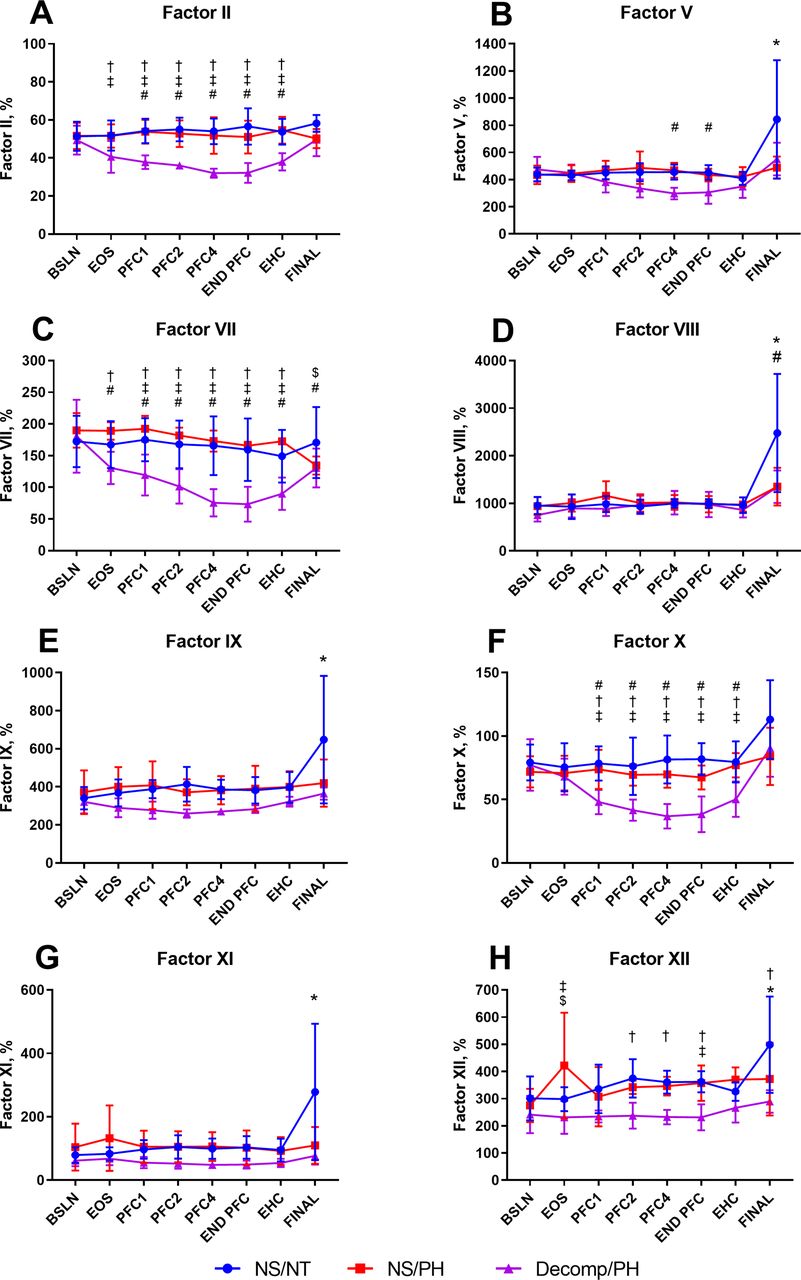
STAGO factors parameters. STAGO factors parameters were measured at all time points. Data are presented as mean±SD for (A) Factor II, (B) Factor V, (C) Factor VII, (D) Factor VIII, (E) Factor IX, (F) Factor X, (G) Factor XI, and (H) Factor XII. Colors indicate groups: NS/NT, blue; NS/PH, red; Decomp/PH, purple. P values of <0.05 were considered to be statistically significant. Significant differences between groups are indicated as: NS/NT versus Decomp/PH=† and NS/PH versus Decomp/PH=‡. Significant differences relative to BSLN are indicated as: NS/NT=*, NS/PH=$, and Decomp/PH=#. BSLN, baseline; Decomp/PH, decompensated hemorrhage+hypotension; EHC, end of hospital care; END PFC, end of PFC; EOS, end of shock; FINAL, euthanasia; NS/NT, non-shock/normotensive; NS/PH, non-shock/permissive hypotensive; PFC, prolonged field care.


